
Chicago break-ins by community area
Police-reported residential burglaries for all 77 community areas in Chicago, ranked by the number reported, from most to fewest. Find yours, see how it compares, and what to do about it.
- SourceCity of Chicago Data Portal, Crimes - 2001 to Present, published by the Chicago Police Department
- Years2024 and 2025
- CountsHomes only: houses and apartments
- Ranked byNumber reported, not a per-person rate
residential burglaries reported in 2025, 8.6% fewer than the 4,783 reported in 2024.
All 77 community areas, ranked by number reported
Each bar is one community area. Larger and denser areas have more homes, so a higher count does not mean each household is at higher risk. Hover or tap to read the numbers.
Houses and apartments
2025 compared with 2024
Residential burglaries reported.
Find your community area
| Rank | Community area | Reported, 2025 | Houses | Apartments | 2024 | Change |
|---|---|---|---|---|---|---|
| 1 | South Shore | 263 | 46 | 217 | 362 | −99 |
| 2 | Austin | 190 | 65 | 125 | 199 | −9 |
| 3 | Auburn Gresham | 174 | 81 | 93 | 160 | +14 |
| 4 | Lake View | 161 | 51 | 110 | 139 | +22 |
| 5 | Chatham | 156 | 60 | 96 | 141 | +15 |
| 6 | Greater Grand Crossing | 146 | 38 | 108 | 177 | −31 |
| 7 | West Town | 140 | 78 | 62 | 214 | −74 |
| 8 | Roseland | 132 | 103 | 29 | 120 | +12 |
| 9 | West Pullman | 124 | 108 | 16 | 77 | +47 |
| 10 | Lincoln Park | 111 | 46 | 65 | 104 | +7 |
| 11 | Englewood | 108 | 55 | 53 | 88 | +20 |
| 12 | Edgewater | 107 | 38 | 69 | 91 | +16 |
| 13 | South Chicago | 105 | 41 | 64 | 100 | +5 |
| 14 | Uptown | 104 | 25 | 79 | 121 | −17 |
| 15 | Logan Square | 92 | 47 | 45 | 124 | −32 |
| 15 | West Ridge | 92 | 47 | 45 | 83 | +9 |
| 17 | Near West Side | 90 | 32 | 58 | 119 | −29 |
| 18 | North Lawndale | 84 | 16 | 68 | 93 | −9 |
| 19 | Humboldt Park | 81 | 49 | 32 | 115 | −34 |
| 20 | Near North Side | 80 | 25 | 55 | 93 | −13 |
| 21 | Chicago Lawn | 79 | 45 | 34 | 77 | +2 |
| 22 | Woodlawn | 72 | 24 | 48 | 92 | −20 |
| 23 | Rogers Park | 67 | 19 | 48 | 72 | −5 |
| 23 | Washington Heights | 67 | 58 | 9 | 52 | +15 |
| 25 | West Englewood | 62 | 42 | 20 | 67 | −5 |
| 26 | Grand Boulevard | 61 | 20 | 41 | 71 | −10 |
| 27 | Bridgeport | 59 | 39 | 20 | 51 | +8 |
| 28 | Hyde Park | 54 | 15 | 39 | 65 | −11 |
| 29 | New City | 51 | 32 | 19 | 61 | −10 |
| 30 | Belmont Cragin | 50 | 36 | 14 | 51 | −1 |
| 30 | Irving Park | 50 | 29 | 21 | 64 | −14 |
| 32 | North Center | 49 | 28 | 21 | 47 | +2 |
| 33 | East Garfield Park | 48 | 10 | 38 | 58 | −10 |
| 33 | Portage Park | 48 | 39 | 9 | 69 | −21 |
| 35 | South Lawndale | 47 | 27 | 20 | 39 | +8 |
| 36 | Lincoln Square | 45 | 22 | 23 | 64 | −19 |
| 37 | West Garfield Park | 44 | 13 | 31 | 47 | −3 |
| 38 | Garfield Ridge | 43 | 39 | 4 | 53 | −10 |
| 39 | Dunning | 40 | 34 | 6 | 40 | 0 |
| 40 | Brighton Park | 38 | 24 | 14 | 34 | +4 |
| 41 | Ashburn | 33 | 29 | 4 | 40 | −7 |
| 41 | Kenwood | 33 | 9 | 24 | 45 | −12 |
| 43 | Albany Park | 32 | 21 | 11 | 59 | −27 |
| 43 | Morgan Park | 32 | 30 | 2 | 27 | +5 |
| 43 | Washington Park | 32 | 6 | 26 | 34 | −2 |
| 46 | Avondale | 30 | 11 | 19 | 37 | −7 |
| 46 | West Lawn | 30 | 24 | 6 | 47 | −17 |
| 48 | Avalon Park | 29 | 18 | 11 | 22 | +7 |
| 48 | Lower West Side | 29 | 16 | 13 | 35 | −6 |
| 50 | Douglas | 28 | 8 | 20 | 39 | −11 |
| 50 | McKinley Park | 28 | 25 | 3 | 23 | +5 |
| 52 | Calumet Heights | 27 | 23 | 4 | 34 | −7 |
| 52 | Norwood Park | 27 | 22 | 5 | 38 | −11 |
| 54 | Loop | 26 | 4 | 22 | 26 | 0 |
| 54 | South Deering | 26 | 20 | 6 | 20 | +6 |
| 56 | East Side | 23 | 19 | 4 | 32 | −9 |
| 57 | Near South Side | 22 | 9 | 13 | 20 | +2 |
| 58 | Forest Glen | 21 | 18 | 3 | 16 | +5 |
| 58 | North Park | 21 | 15 | 6 | 16 | +5 |
| 60 | Beverly | 20 | 18 | 2 | 14 | +6 |
| 60 | Gage Park | 20 | 16 | 4 | 31 | −11 |
| 60 | Hermosa | 20 | 13 | 7 | 22 | −2 |
| 63 | Clearing | 19 | 14 | 5 | 26 | −7 |
| 64 | Armour Square | 17 | 8 | 9 | 9 | +8 |
| 64 | Jefferson Park | 17 | 10 | 7 | 24 | −7 |
| 66 | West Elsdon | 16 | 15 | 1 | 33 | −17 |
| 67 | Riverdale | 14 | 8 | 6 | 17 | −3 |
| 68 | Montclare | 12 | 8 | 4 | 15 | −3 |
| 69 | Archer Heights | 11 | 7 | 4 | 17 | −6 |
| 69 | Oakland | 11 | 5 | 6 | 12 | −1 |
| 69 | Pullman | 11 | 11 | 0 | 18 | −7 |
| 72 | Fuller Park | 8 | 4 | 4 | 5 | +3 |
| 72 | Mount Greenwood | 8 | 6 | 2 | 6 | +2 |
| 74 | Edison Park | 7 | 6 | 1 | 1 | +6 |
| 74 | Hegewisch | 7 | 7 | 0 | 13 | −6 |
| 74 | O'Hare | 7 | 3 | 4 | 8 | −1 |
| 77 | Burnside | 5 | 3 | 2 | 8 | −3 |
No community areas match that search.
Ranked by 2025 count. These are counts, not rates: larger and denser areas have more homes, so a higher count does not mean each household is at higher risk.
What to do about it
Most reported break-ins here were at apartments, so focus on your own door and the ways into the building.
- Start with your door. A video doorbell or door-facing camera shows who comes to your suite door and records activity there.
- Check your rules first. If you rent or live in a condo, read your lease or building rules before mounting anything, and point cameras only at your own door or space.
- Look at other access points. Balcony doors, ground-floor windows and shared entrances are worth a look.
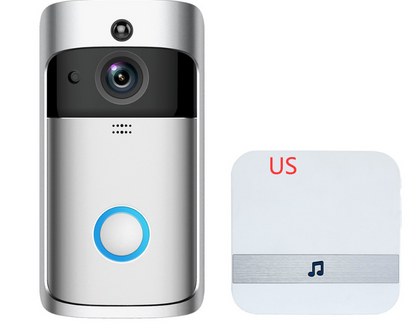
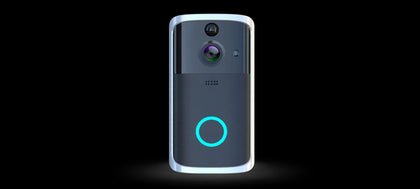
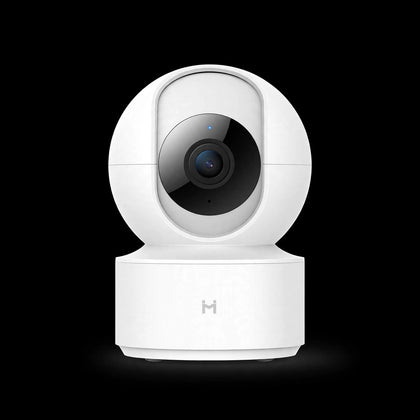

A camera doesn't stop a break-in by itself. It lets you see what is happening and keeps a recording.
Use this data
Download
Every community area on this page, with 2025 and 2024 figures, as a spreadsheet-ready CSV file.
Download CSVCite this page
Free to use with credit. Please cite MkaeSense and the original publisher.
More places
What the totals don't show
We dug further into the data. Only 1 in 6 Canadian break-ins leads to a charge, about half of home burglaries need no force, and Friday is the peak day in Toronto, Chicago and New York.
About this data
Source. City of Chicago Data Portal, Crimes - 2001 to Present, published by the Chicago Police Department.
What is counted. Counts are reports with a primary type of Burglary at residential locations, by the year they occurred. Houses means residences, house locations and residential driveways; apartments means apartment buildings and Chicago Housing Authority (CHA) buildings. The data is updated regularly and reports can be reclassified, so figures may change. Areas are Chicago's 77 official community areas.
How to read it. These figures cover crimes reported to police, not every crime that happens. Rankings, medians and changes are our own calculations from the published data, and a change from one year to the next can reflect reporting practices as well as real trends. MkaeSense is not affiliated with the data publisher, and this is general information, not a prediction for any home or street.