
2025 Safety Index for 1,399 places
See the risk where you live.Put the data to work.
Explore 1,274 US cities and 125 Canadian police-service areas in the current collection, using published police data. Start with your town and see what the records can tell you.
1,399 places scored 0 to 100 on 2025 police data. How it works
Data release 2025.1, updated 31 October 2026. See what changed
Safety Index 202560 and up40 to 59under 40
Scanning 1,399 placesHover or tap a dot
The Safety Index is a relative ranking among places, not a probability of crime. How the score works
- 1,399places scored on the 2025 Safety Index
- −60%US burglary rate, 2015 to 2025
- −41%Canada break-in rate, 2015 to 2025
- 1 in 5Toronto collisions in 2025 were hit-and-runs
- 2.8%of thefts from cars cleared in Canada, 2025 (Statistics Canada)
- 10pmbusiest hour for car theft in Toronto
- Julyriskiest month for break-ins and car theft in large US cities
- −20%US car thefts, January to August 2026, across 160 cities
Crime data for your street, your city and your country.
Explore recorded patterns alongside their sources, units and coverage. Historical comparisons describe reported crime; they do not predict what will happen at an address.
Answers come only from the figures published on this site. No outside AI writes them.
Behind the headline
Browse all locations ↗Your city. More than one number.
Explore historical trends, reporting gaps and local patterns. No account required.
Explorer data is a dated release. Check the live monitoring manifest for current collection dates, archive hashes and comparisons. Explorer manifest (JSON) · Live monitoring manifest (JSON)
Loading the underlying records…
Browse the existing city reports
Flagship ranking
The safest cities in Canada and the US, 2025
All 1,399 places ranked within their country. Highest scores among places of 300,000+ people:
Live, at 2025 average ratesSince you opened this page
A burglary is reported in the US about every 47 seconds, and a break-in in Canada about every 4.8 minutes.
0US burglaries
0Canadian break-ins
Break-in trackerCountries down to neighbourhoods
Canada’s break-in rate per 100,000 people, 2015 to 2025.
TorontoHow safe is your address?
Type an address to get its neighbourhood’s break-in rate and rank out of 158.
Car crime atlasWhen cars get stolen
In Toronto, 10pm is the busiest hour for car theft, and 41% happen in parking lots.
United States, large citiesBurglary and car theft, 2015 to 2025
National rates per 100,000 people. Car theft peaked in 2023; burglary fell every year but one.
NewToronto in 3D
All 158 neighbourhoods rise with their break-in or car theft rate. Press play to watch 2014 to 2025.
Solar winter checkWill solar work at your place in December?
Sunlight in the darkest month for towns across Canada and the US.
New · Free researchYour own research desk
Compare 280 Canadian reporting areas across eleven years. Filter, inspect and export the underlying figures.
280reporting areas
For property and operations teamsPut the data to work
Save supported areas, compare matched periods and keep dated evidence reports in a private workspace.
Sources: Statistics Canada, FBI, Toronto Police Service and city open data.Data releasesMethodLicense the data
What the data says, and what helps
Police clear few of these crimes, so a record you control matters. Each card opens the gear that fits that risk.
1 in 5Canadian break-ins that police cleared in 2025.Statistics CanadaCameras for your home
83,652Vehicles reported stolen in Canada in 2025. 11% were cleared.Statistics CanadaCar theft protection
1 in 5Toronto collisions in 2025 where a driver left the scene.Toronto Police ServiceDash cams
No WiFi?Cottages, farms and job sites need a plan for power and signal before you pick a camera.For places off the gridCottage and off-grid security
Shop
What are you protecting?
Cameras and tools matched to the place, or the problem.
-
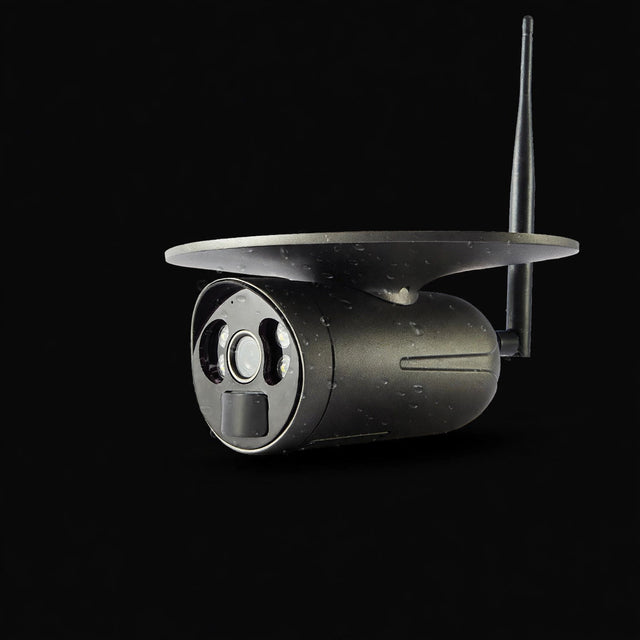 2 items
Cottage & Off-Grid Security4G and solar cameras for places with no Wi-FiShop cottage
-
 5 items
Job-Site Security4G solar cameras, sirens and trackers for tools and equipmentShop job-site
-
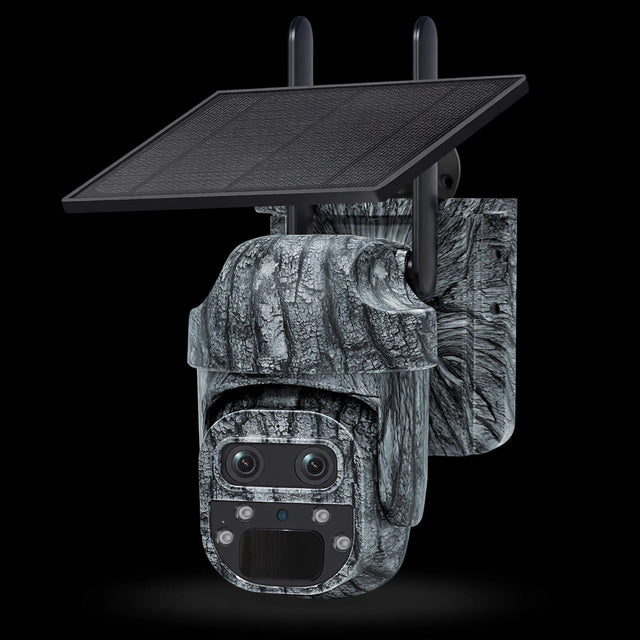 4 items
Farm & Rural SecurityCellular cameras and gate alarms for barns and propertyShop farm
-
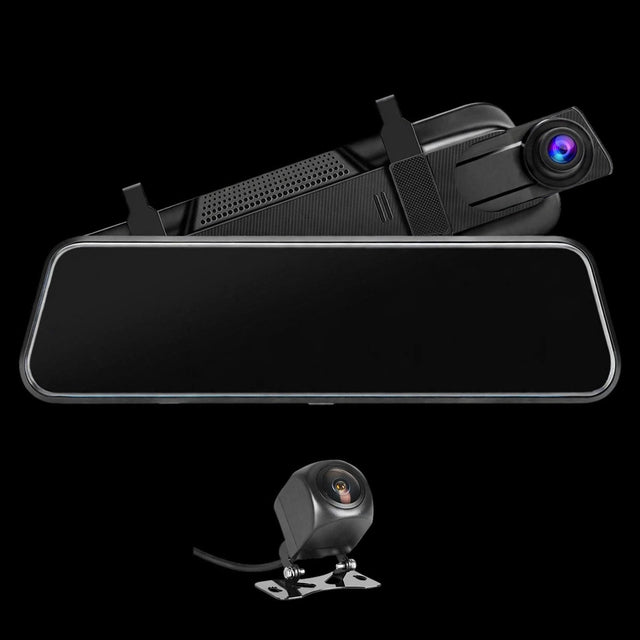 3 items
Car Theft ProtectionTrackers, immobilizers and vibration alarmsShop car
-
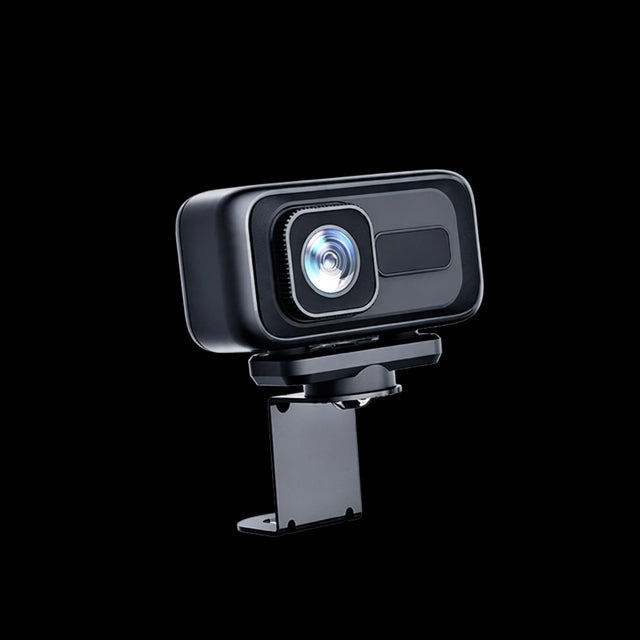 5 items
ATV, E-Bike & Trailer ProtectionHidden GPS tracker, alarms and smart padlockShop atv,
-
 2 items
Porch Pirate ProtectionSensors and alarms that catch deliveries going missingShop porch

01 / 01